1.What information is avaiable in scRef?
Single-cell Assay for Transposase-Accessible Chromatin using sequencing (scATAC-seq) can map the status of genome-wide chromatin accessibility in a single cell, allowing us to explore a wide range of biological phenomena, from developmental plasticity to tumor heterogeneity from the perspective of epigenome coordination of gene expression. Here, we developed a manually curated database of single-cell epigenome data with known cell labels in multi-species (scRef, http://www.licpathway.net/scRef), which aims to provide a large-scale available resources of chromatin accessibility information for more broader and comprehensive cell/tissue types to further provide significant associations in cell subpopulations simultaneously.
2.Data Content in scRef?
The current version of scRef documents a total of 451 cell/tissue types manually annotated by published articles, including the samples from NCBI, Github and Zendo. We manually reviewed more than 600 published literatures across 6 species, comprehensively curated and classed these available samples. To obtain the tissue/cell-type specific scATAC-seq data, we carefully viewed the “Data availability” in each paper to obtain meta.data files with cell type information and matrix files. Cell type labels were manually annotated by published articles. The scATAC-seq data stored in our database includes a total of 451 cell/tissue types, covering 1,427,163 cells (more 1,047,549 more than AgeAnno, > 3 times). Furthermore, the comprehensive genome-wide chromatin accessibility analysis for known cells/tissues is crucial for exploring of cell/tissue heterogeneity, which can help to uncover key cell subtype and potential key factors. Hence, for these cells with known labels, we used the uniform system environment and software parameters to calculate gene activity score, TF z-score and differentially chromatin accessibility regions.
3.How to use the scRef?
3.1.Browse
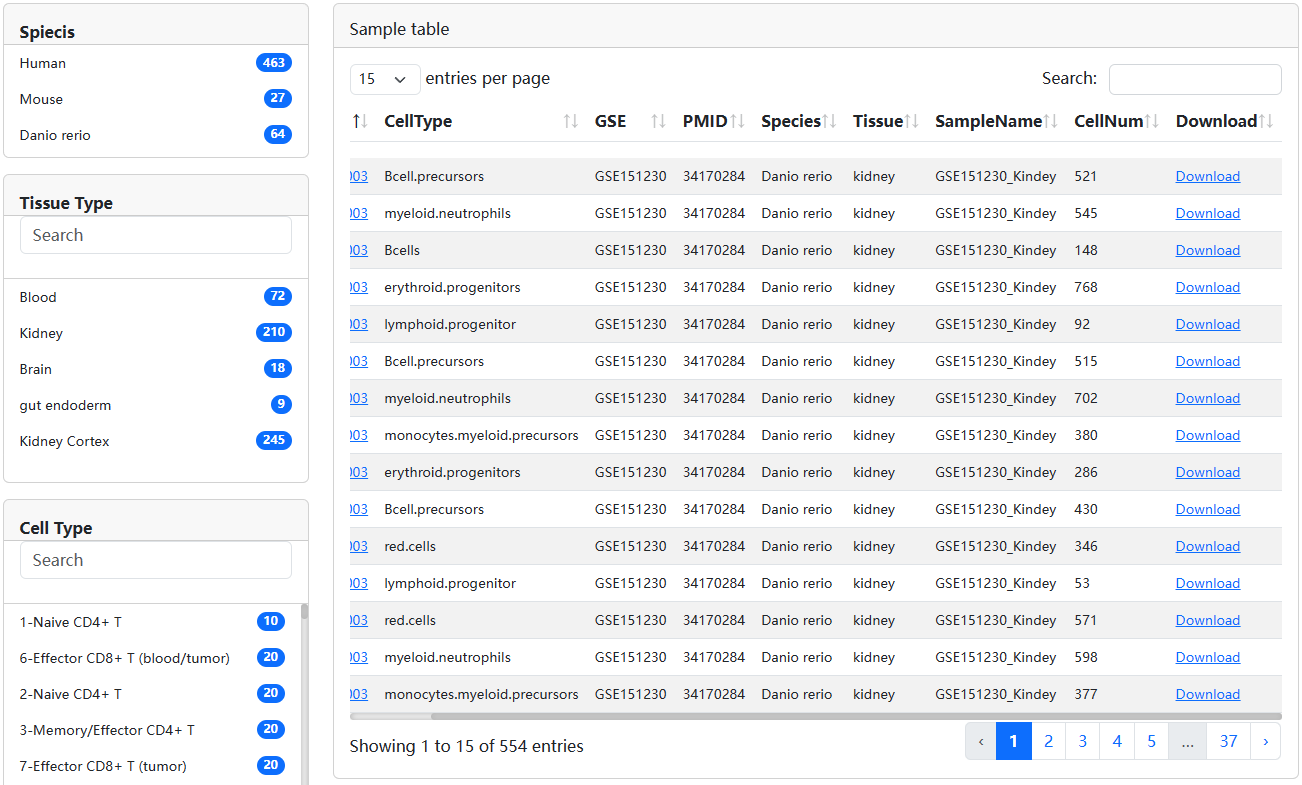
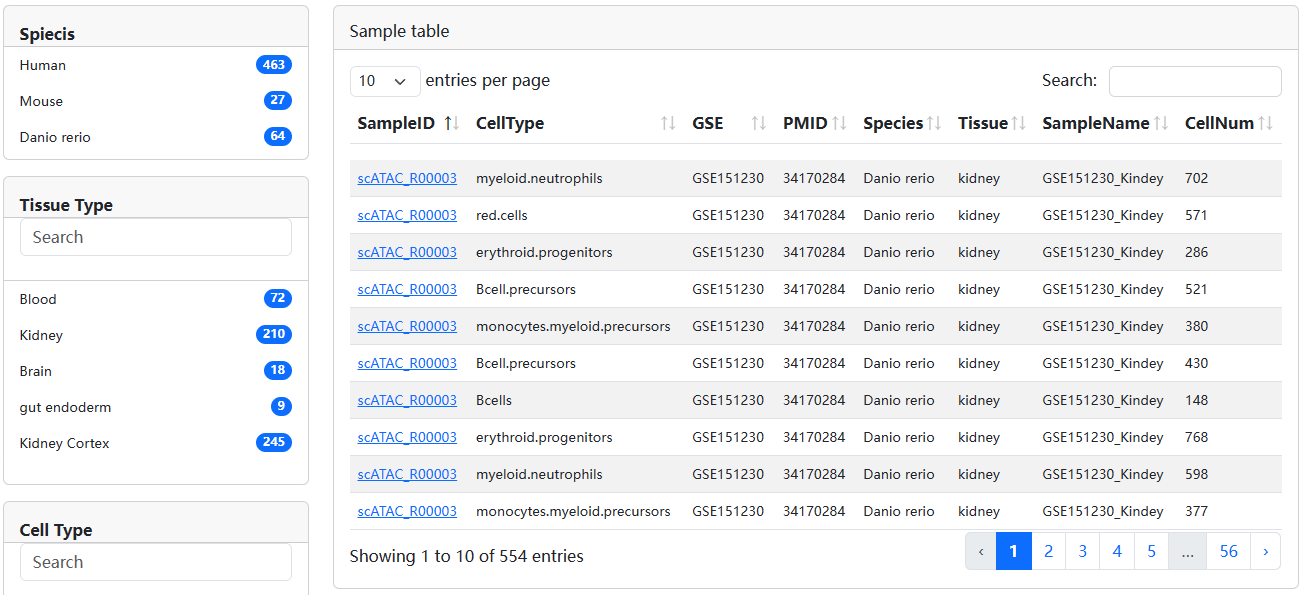
The ‘Browser’ page is organized as an interactive and alphanumerically sortable table that allows users to quickly search for samples and customize filters through ‘Species’, ‘Tissue’, and ‘Known Cell Type’. Users can use the ‘Show entries’ drop-down menu to change the number of records per page. To view the detailed information for a given sample, users only need to click on the ‘Sample ID’ to view it.
3.2.Search
We design three search models, including Search by Cell/Tissue Type, Custom Search and Search by Differentially Chromatin Accessibility Region.
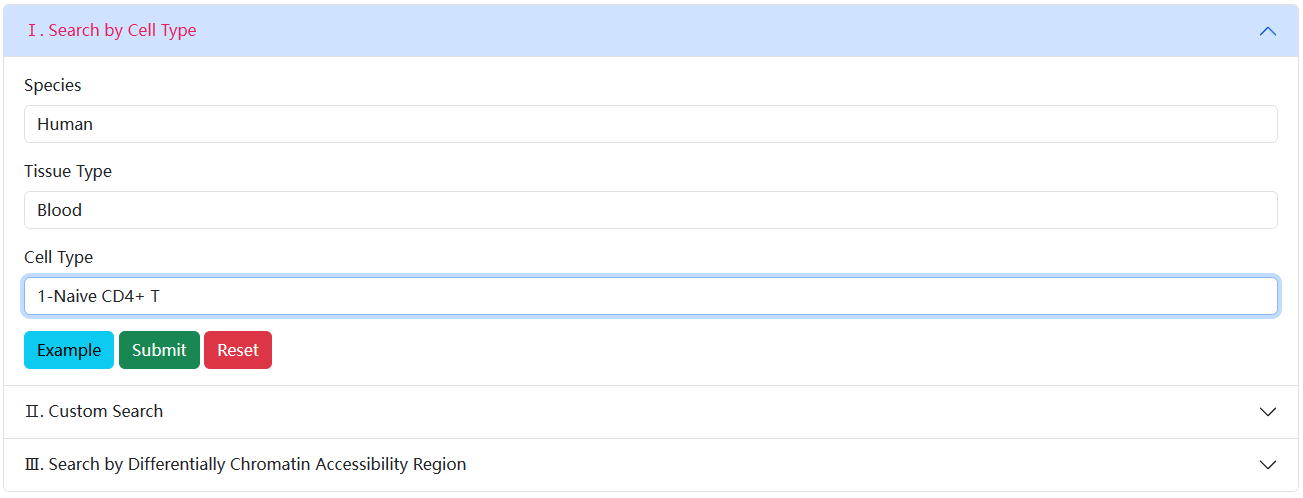
3.2.1 Search by Cell/Tissue Type
In Search by Cell/Tissue Type, users can determine the scope of the samples query by determining the Species, Tissue and Known Cell Type to get the results of interest.
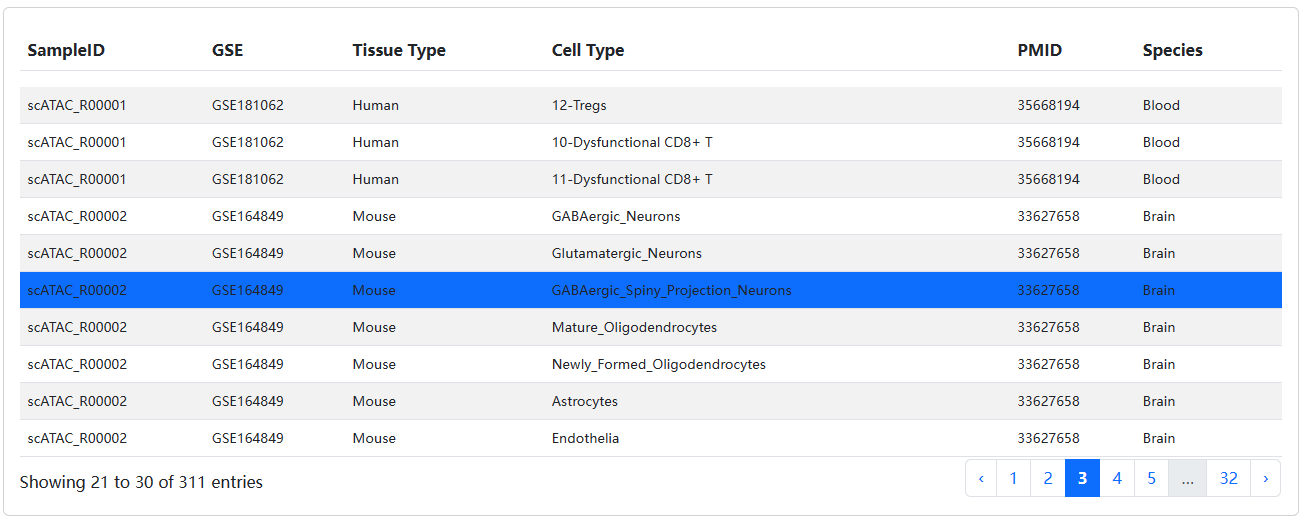
The brief information on the search results is displayed in a table on the result page. The table describes the Sample ID, Known Cell Label, Tissue, etc. Users can click the Sample ID to view the details about each sample.
In the detailed page of sample, we will display the detailed information of sample and known cell type, including the source and description of literature, etc.
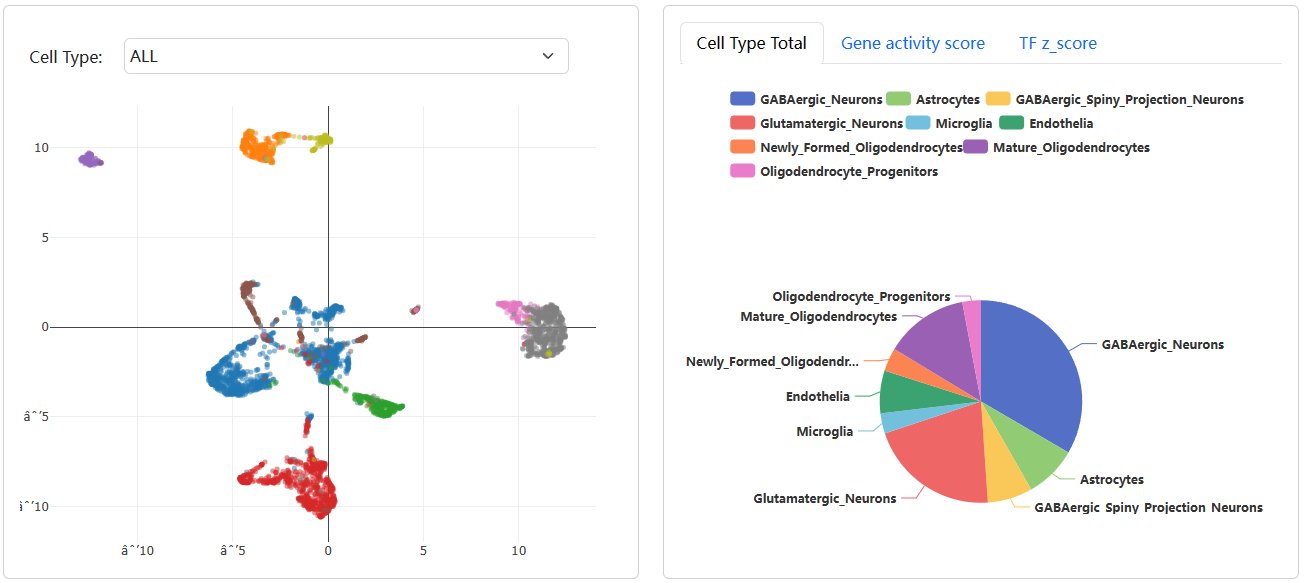
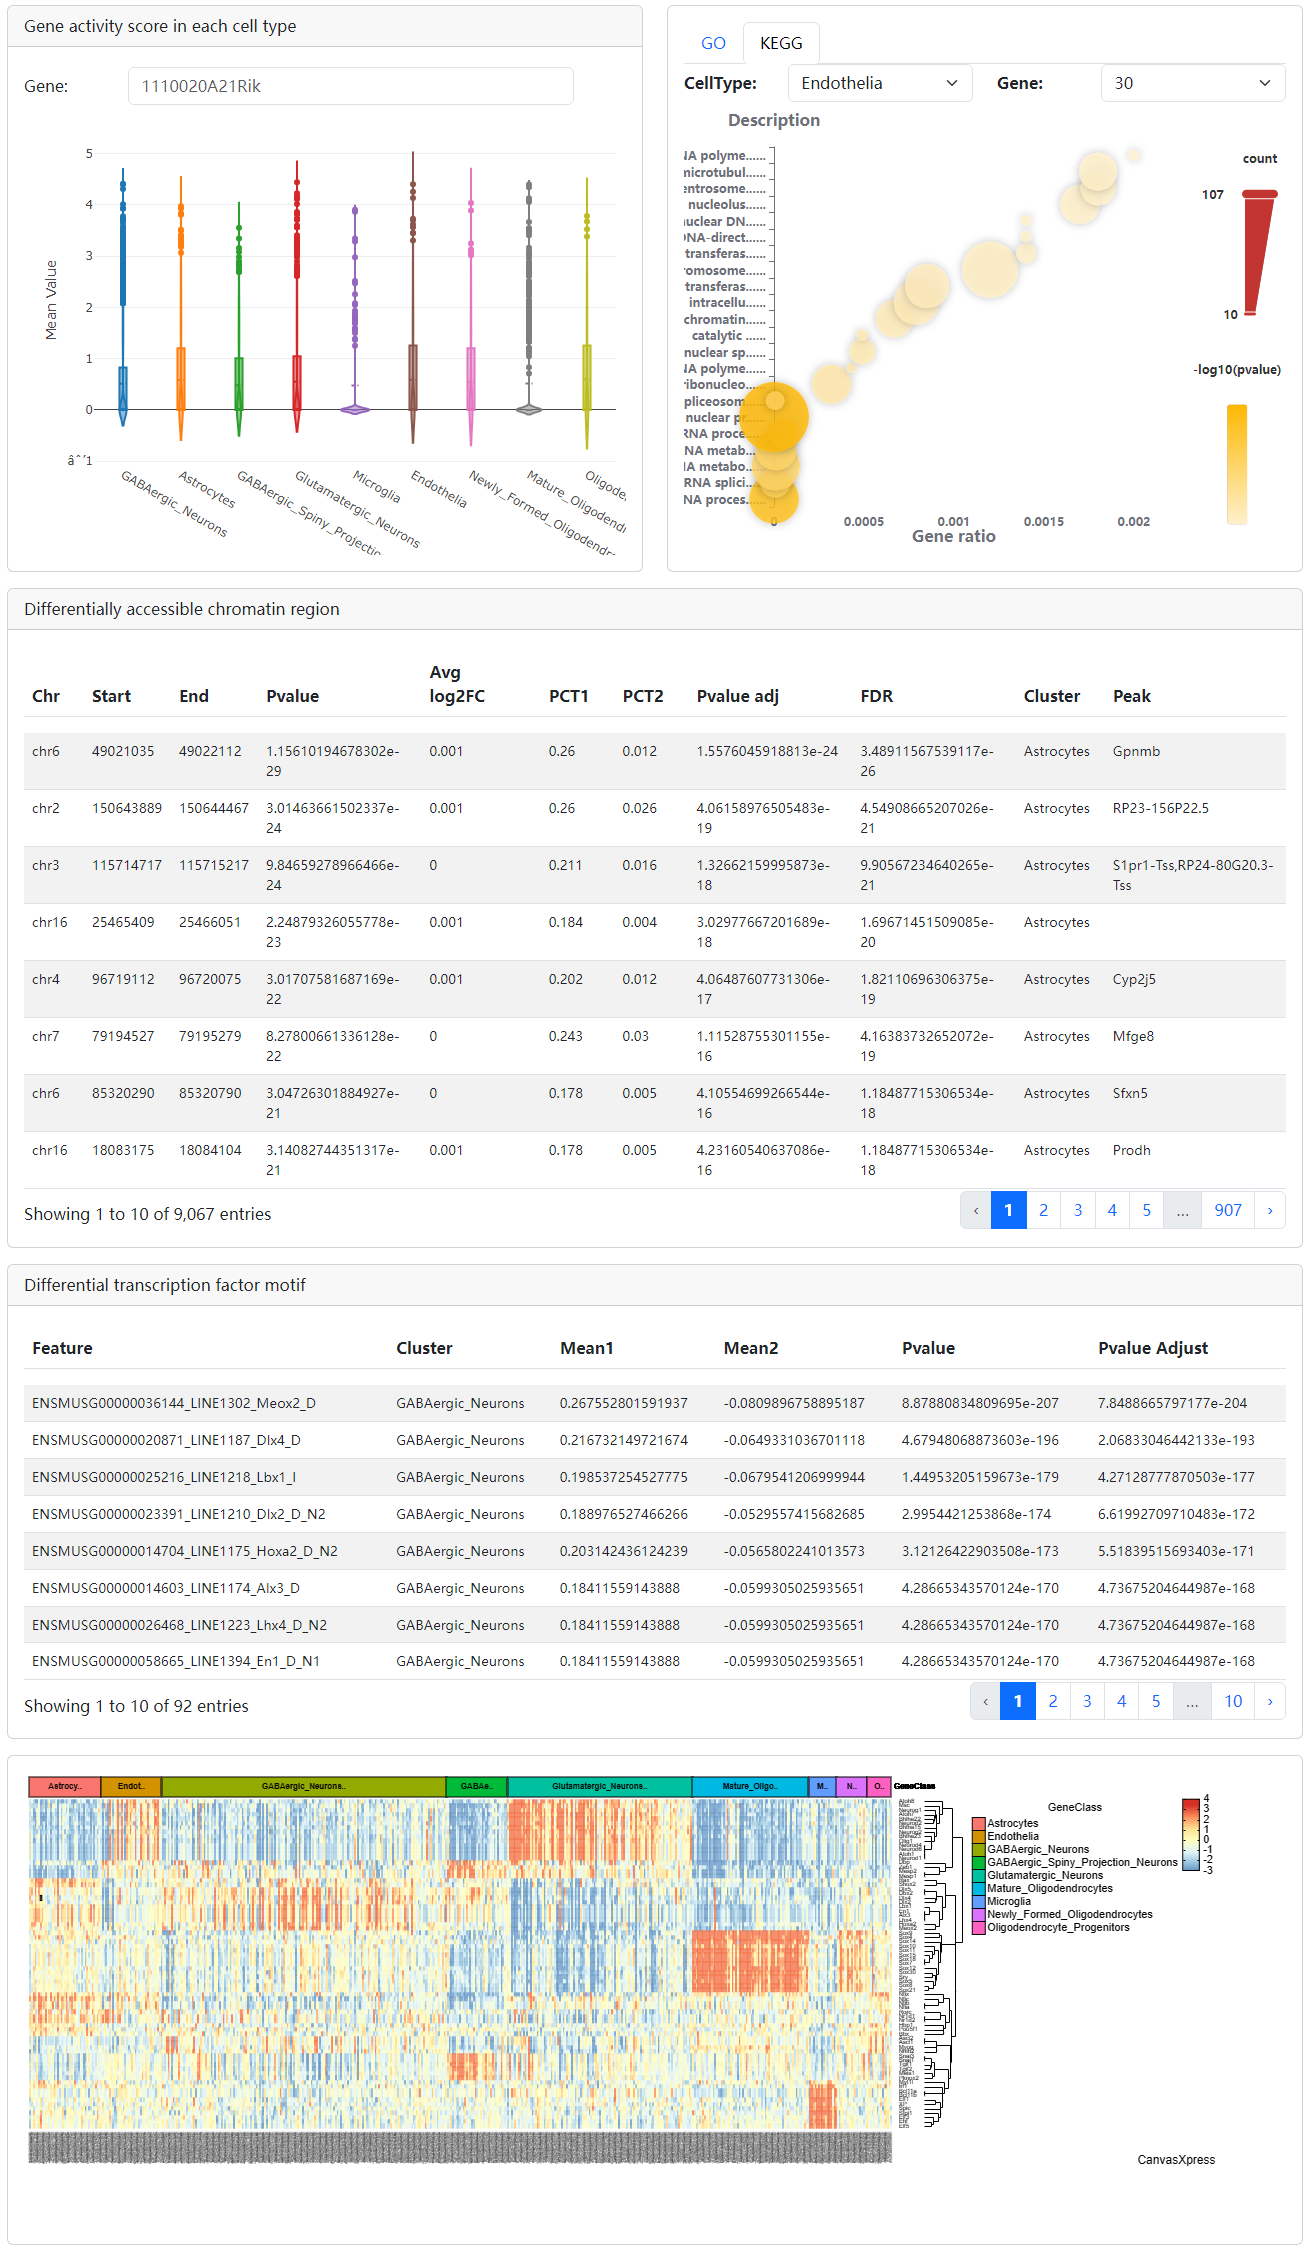
In addition, the diagram of cell cluster, activity score of gene of interest, z-score of TF of interest, the table of differentially chromatin accessibility regions, the table of differentially TFs and the TF heatmap also be provided.
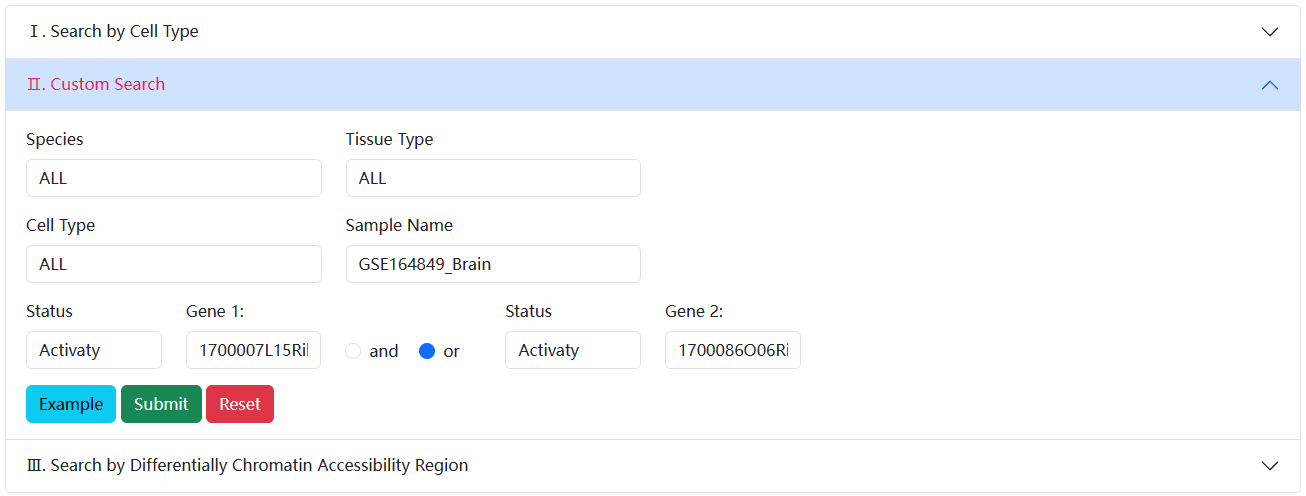
3.2.2. Custom Search
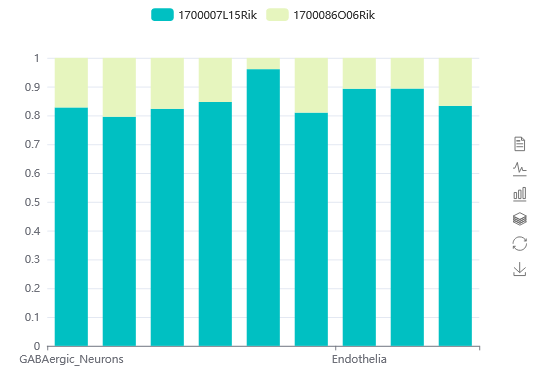
In Custom Search, user can filter cells of interest based on custom gene state (activity or non-activity) in a sample, scRef will view the distribution and detailed information of these cells.
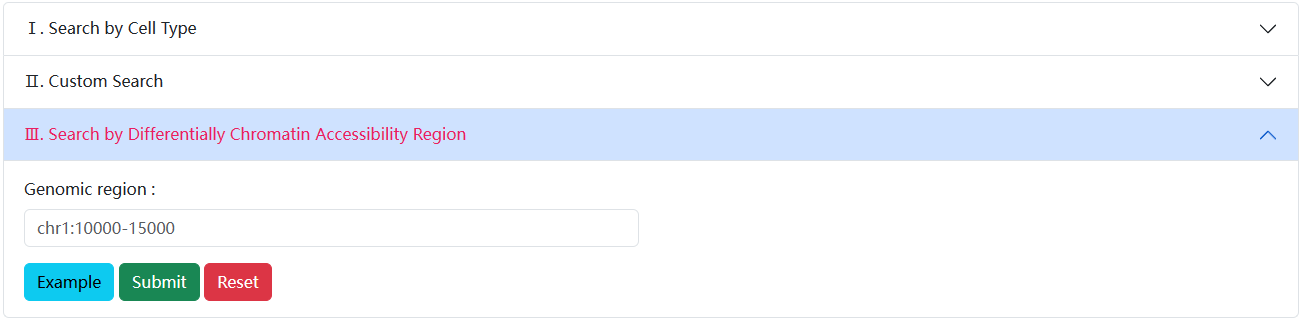
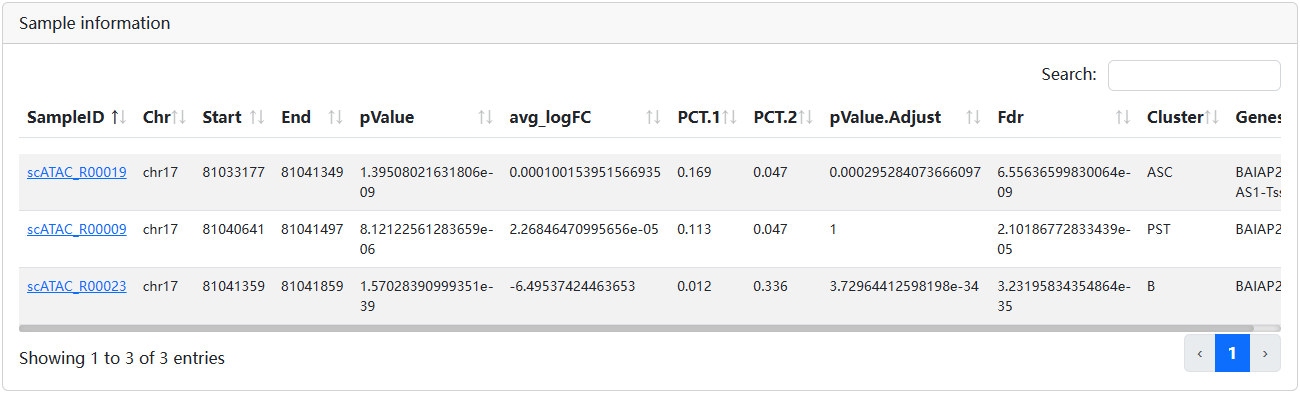
3.2.3 Search by Differentially Chromatin Accessibility Region
User can input the genomic location such as below. scRef will return the differentially chromatin accessibility regions overlapped with the input region.
3.2.4 Compare the two samples
In the search, scRef supports the detailed exploration of between two datasets.
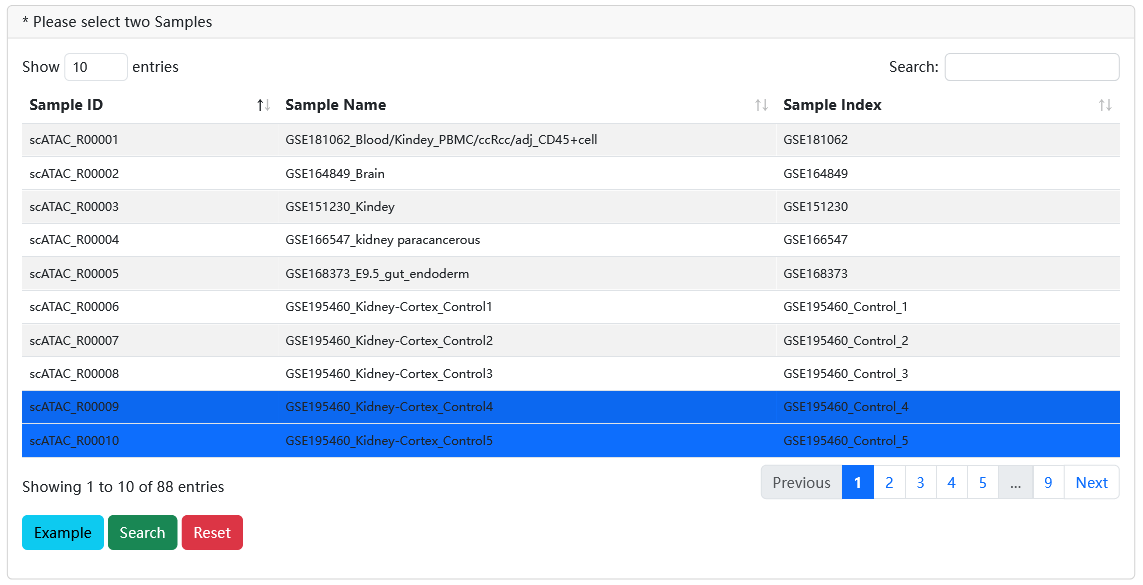
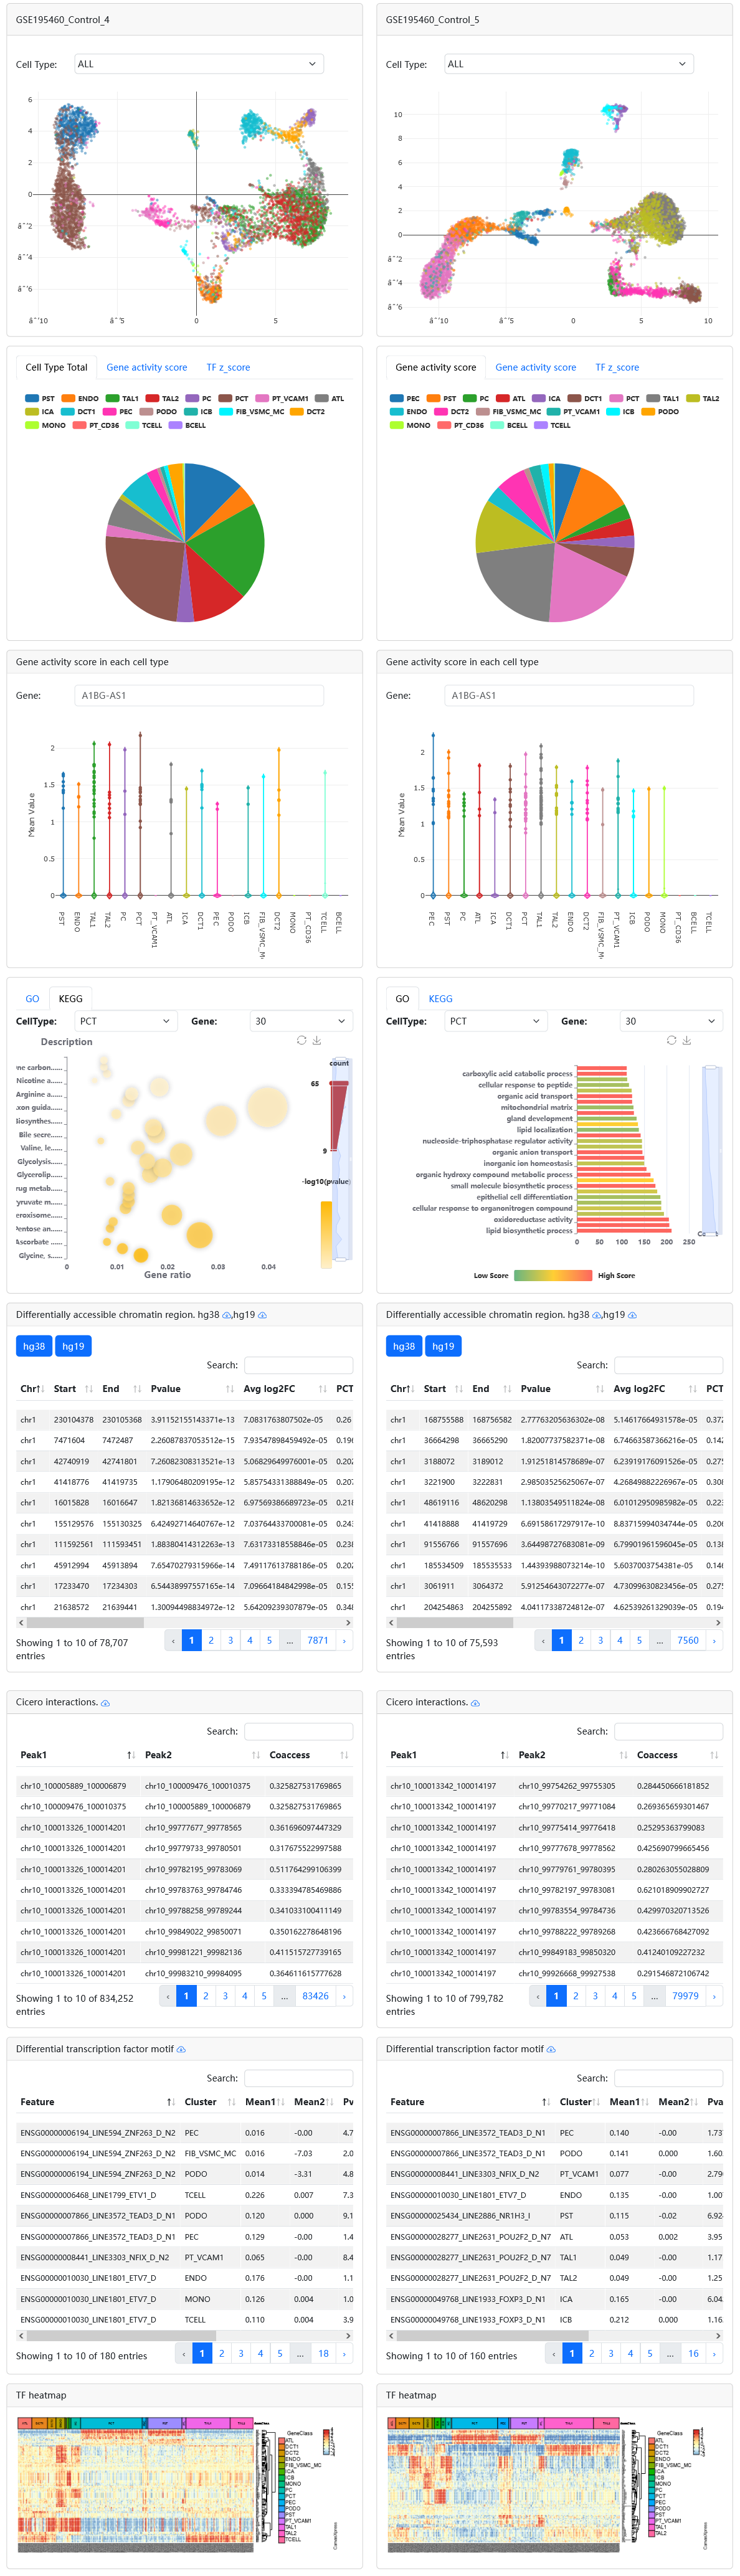
When users select two samples of interest via filtering Species, Tissue, Known Cell Type and SampleName, scRef will display their detailed sample information in two different modules, including an overview page for clustering, known cell type labels. Meanwhile, it also supports comparative of gene activity score, TF z-score and differentially chromatin accessibility regions.
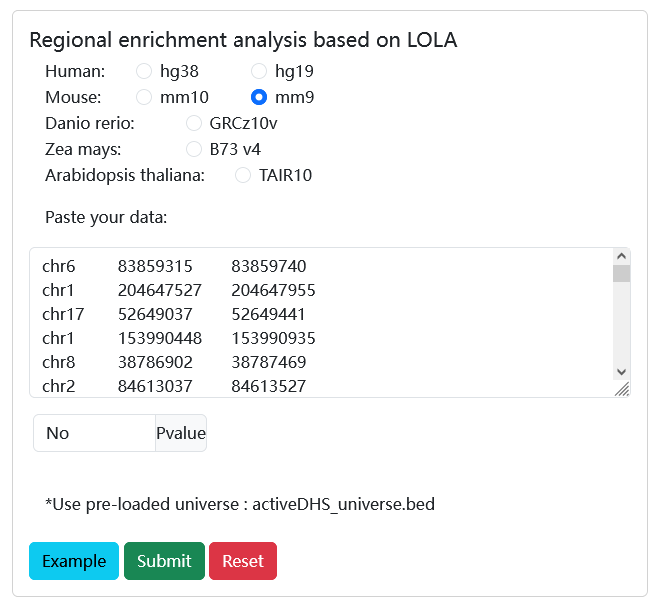
3.3.Analysis
Users can submit a list of genomic regions and set the significance p_value. Then, scRef will use the genomic region enrichment analysis method (LOLA) to calculate the enrichment significance between the input regions and reference sets to identify the cell/tissue types that are significantly enriched.
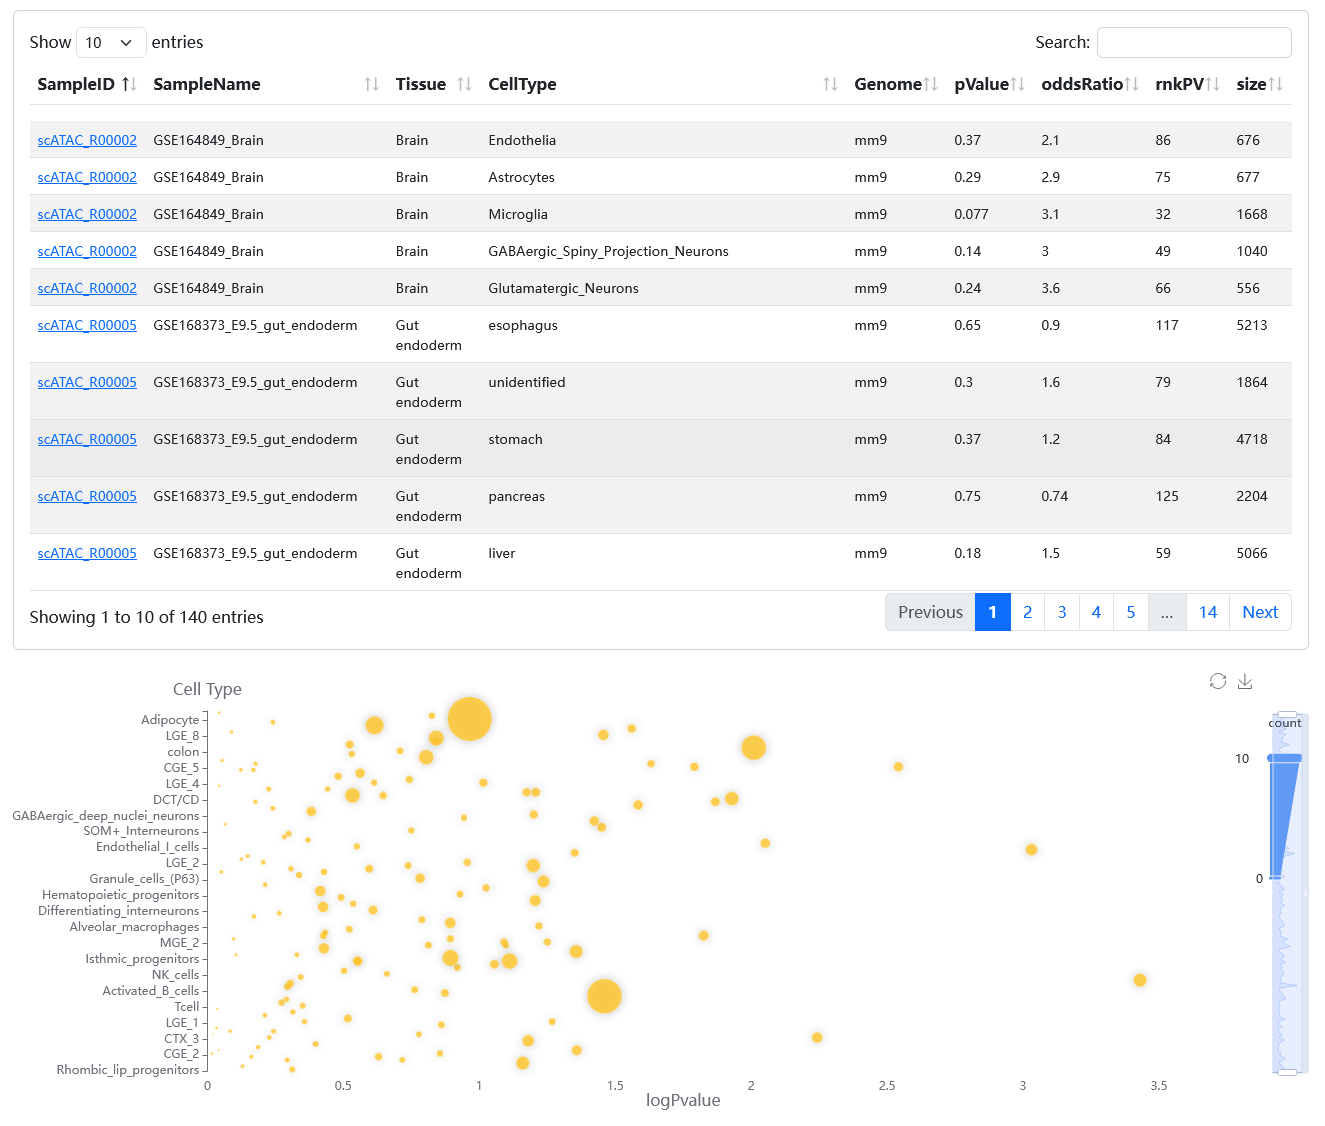
On the results page, the bubble chart shows the enrichment analysis results and the table describes the details of the enriched cell/tissue types.
3.4.Download
The data of differentially chromatin accessibility regions of all samples are provided for download in the ‘Download’ page. We also support the export of query results in the ‘Search Result’ page.