With the increasing research on diseases and biological processes, scRNA-seq datasets are accumulating rapidly, hightlighting the urgent need for collecting and processing these data to support comprehensive and effective annotation and analysis. Here, we have developed a comprehensive Single-Cell transcriptome Integration database for human and mouse (SCInter, https://bio.liclab.net/SCInter/index.php), which aims to provide a manually curated single cell transcriptome integration database and supports the provision of gene expression profiles across cell types at sample level.
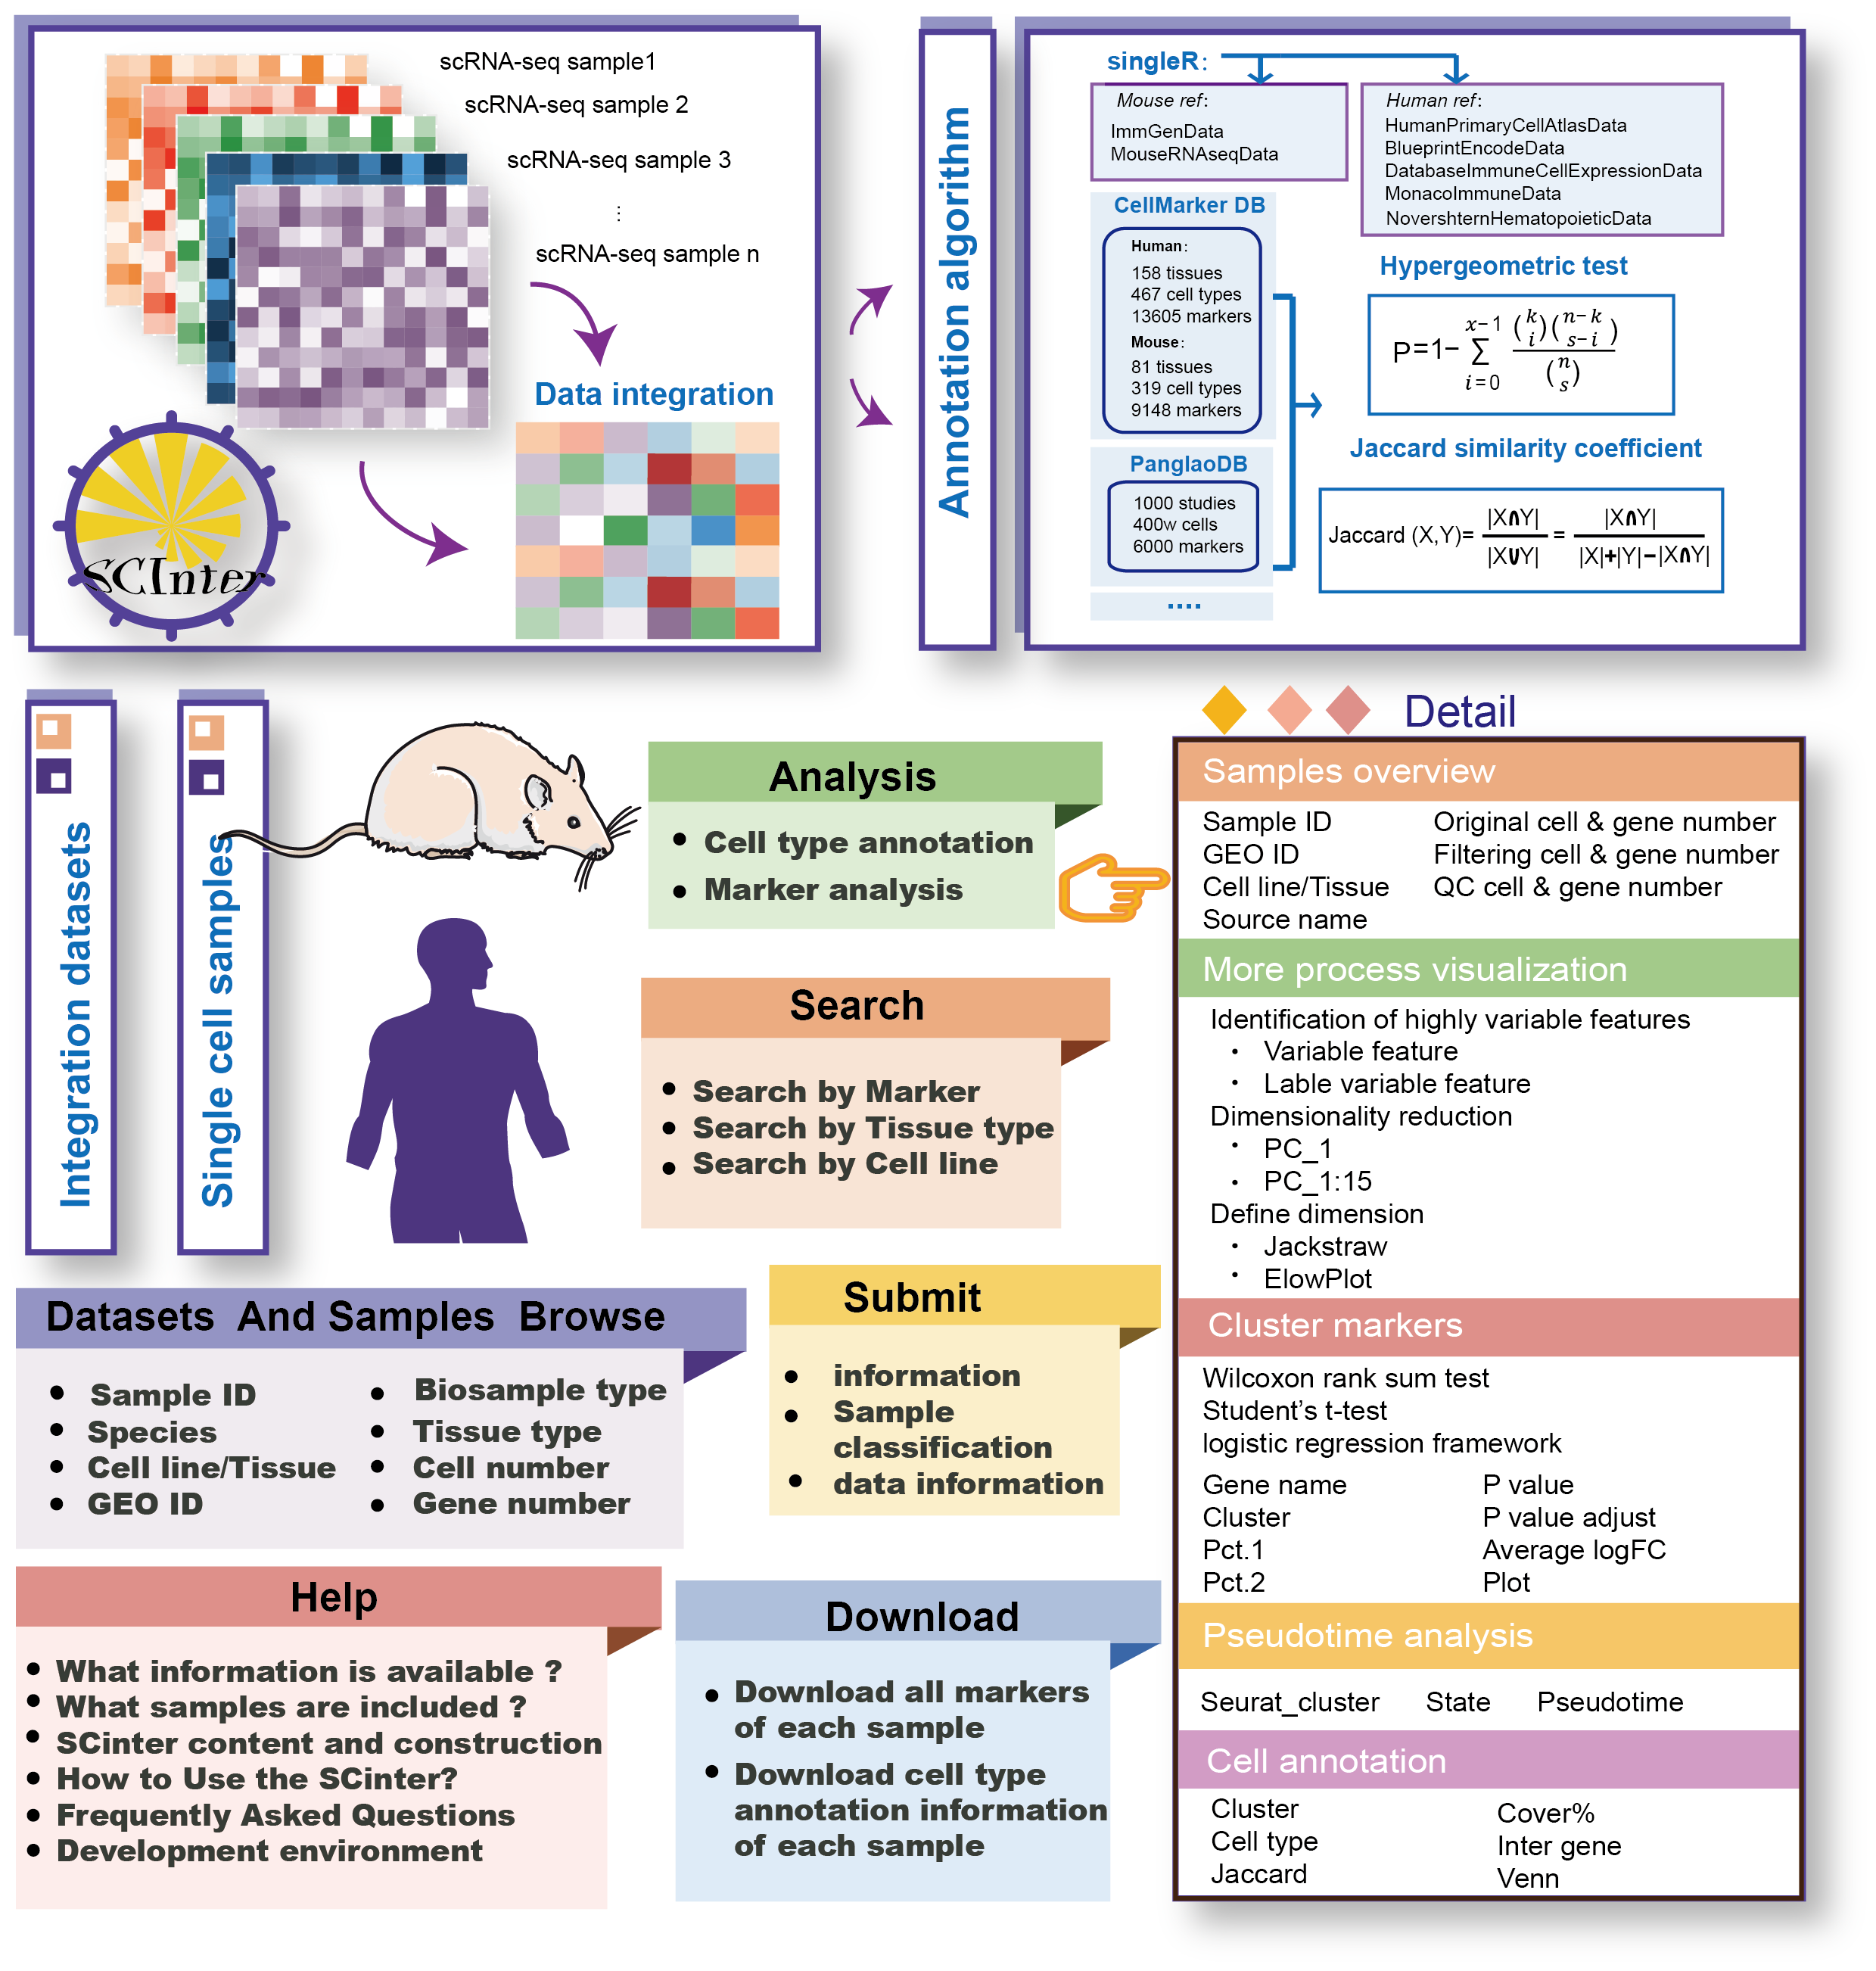
The current version of SCInter includes 115 integrated datasets and 1016 samples, covering nearly 150 tissues/cell lines. It contains 8,016,646 cell markers in 457 identified cell types. SCInter enabled comprehensive analysis of cataloged single-cell data encompassing quality control (QC), clustering, cell markers, multi-method cell type automatic annotation, predicting cell differentiation trajectories and so on. At the same time , SCInter provided a user-friendly interface to query, browse, analyze and visualize each integrated dataset and single cell sample, along with comprehensive QC reports and processing results.
SCInter is a database for comprehensive single-cell transcriptome integration database for human and mouse with a large amount of datasets. Importantly, SCInter not only provides useful single-cell clustering analysis to identify specific cell markers, but also available pseudotime analysis and cell type automatic annotation. Our effort to establish this platform was prompted by the great need of researchers to understand single cell transcriptome. In addition, the single cell field is developing at an unprecedented speed and has became one of the most concerned areas.
4.1 Browse
4.1.1 Integration datasets bowse
The ‘Data-Browse’ page is organized as an interactive and alphanumerically sortable table that allows users to quickly browse samples and customize filters through sample id/dataset id, biosample type and name, tissue type, GEO id, cell/gene number and plot diagram. Users may further click on the “Dataset ID” to view integration data information for a given sample.

4.1.2 Single samples bowse
The ‘Data-Browse’ is organized as an interactive and alphanumerically sortable table that allows users to quickly browse single cell samples and customize filters through ‘Sample ID’, ‘Species’, ‘Cell line/Tissue type’, ‘GEO ID’, ‘Cell number’ and ‘Gene number’. Users can use the ‘Show entries’ drop-down menu to get different number of records per page. To view the single cell data for a given sample, users only need to click on the ‘Sample ID’.

4.2 Search
SCInter is a powerful platform that provides users with an intuitive search interface to access single-cell data. Users can determine the scope of single cell integration datasets and single samples query through three paths including “Search by tissue type (input tissue name of interest)”, “Search by cell type (input cell type name of interest)” and “Search by marker (input marker gene name of interest)”

Search result of single cell information for Sample_h_001
Users determine the scope of the single cell query by determining Marker, the Tissue type and Cell line for the results of interest. Brief information on the search results is displayed in a table on the result page. As an example, when users choose one sample, SCInter Show information for the following modules of single cell.


4.3 Analysis
URL:https://bio.liclab.net/SCInter/Analysis.php
4.3.1 Cell type annotation analysis
In the “Cell type annotation” tool, users submitted a gene list for cell type analysis. SCInter performed hypergeometric tests and calculated the Jaccard similarity between the submitted gene list and the gene set of each cell type from CellMarker or PanglaoDB to identify possible related cell types. Users have the option to select the reference genome of interest. The results table displayed cell types, intersection genes, the number of intersection genes and hypergeometric test P values. Additionally, SCInter provides Venn diagrams as the results of hypergeometric enrichment. When selecting the cell type of interest, all samples of relevant cell types were listed, and the user further observed detailed information. In addition, users can also further explore the correlation between these input genes and identified markers related cell types through a co-expression network.

4.3.2 Marker analysis
Using the “”Marker analysis”” tool, users can analyze any sample and any gene of interest. SCInter provides two visualization methods, UMAP and tSNE, for users to choose from. The analysis results provide detailed information about the input genes in the specific sample, including the gene expression distribution and co-expression with other markers. We use heatmap and network map to display the co-expression results of each marker gene. Notably, asterisks are used to highlight the genes of interest, and users can freely choose the top 20 or top 30 marker genes for viewing.

4.4 Download
SCInter provided data downloading in “.csv” and “.txt” format, including all marker profiles, cell annotation information and visualization graphs for each integration dataset and single cell sample. In addition, SCInter supported export query results for each search result page. Users also can download all visual vector diagrams and tables in the database as valuable supplementary data for in-depth experimental research.

The SCInter website runs on the Linux-based Apache Web server 2.4.6 (http://www.apache.org) and is developed using MySQL 5.7.27 (http://www.mysql.com). The current version of SCInter uses PHP 5.6.40 (http://www.php.net) server-side scripts. In addition, the SCInter web interface is developed and constructed based on Bootstrap v3.3.7 (https://v3.bootcss.com) and JQuery v2.1.1 (http://jquery.com). Furthermore, ECharts (http://echarts.baidu.com) used as a graph visualization framework. This database has been tested with Mozilla Firefox, Google Chrome and Internet Explorer web browsers. The research community can freely access the information in the SCInter database without registering or logging in. The URL of SCInter is https://bio.liclab.net/SCInter/index.php.
The materials and frameworks used by SCInter are shared by the network and do not contain intellectual property infringement. If there is any infringement, please write to us and we will change it in time.
